Non-Invasive Glucose Sensing: A First-Principles Architecture
A first-principles architectural thesis: non-invasive glucose monitoring has remained open for twenty-five years not because any single domain is unsolved, but because the binding constraint is integration across optics, tissue physiology, silicon photonics, thermal control, and inference.
By Ashutosh Shastry, PhD, MBA
A working architecture, not a finished product. Numerical claims trace to cited literature; every architectural choice is a hypothesis, called out inline with the rationale and the conditions that would falsify it. A truly non-invasive glucose monitor on the wrist remains unbuilt; this essay sets out the architecture and the engineering bets that follow.
Twenty-five years after Cygnus’s GlucoWatch reached the FDA, no truly non-invasive glucose monitor has shipped. That fact tells you something. Plenty of smart people have tried. The constraints have stayed the same. The physics has stayed the same. The device hasn’t shipped because the problem is deceptively hard, and the only way to ship one is to integrate four very different layers into one coherent architecture. This essay walks through why the problem is hard, and what those four layers would look like.
A 25-year scoreboard
Wrist glucose sensors have one main axis of progress: how much they disrupt the skin and the tissue underneath it. Here is where each architecture has landed.
| Generation | Method | Insult to skin | Status |
|---|---|---|---|
| Cygnus GlucoWatch (1990s–2001) | Reverse iontophoresis pulling interstitial fluid to the surface | Chronic electrical irritation; cumulative damage caused the recall | Withdrawn |
| ArKal (2010s) | Hollow microneedles into the dermis at ~1 mm | Foreign-body response choked diffusion at ~72 hours | Never commercialized |
| Dexcom G7, Abbott Libre 3 (today) | Subcutaneous filament at 4–5 mm, glucose oxidase electrochemistry | Continual foreign-body response managed with biocompatible membrane chemistry; 10–14 day wear | Commercial continuous glucose monitor (CGM) leaders |
| Biolinq Shine (2025) | Intradermal microneedle array at ~500 µm, redundant electrochemistry | Shallow penetration, redundancy at the tips | FDA De Novo cleared |
| Apple-Rockley class | Near-infrared (NIR) spectroscopy through intact skin | None: no breach, no current | Not shipped |
Two patterns jump out. The subcutaneous filament class, Dexcom and Abbott, has stayed in the same architectural depth bracket for 25 years. Filament diameters shrank, on-body footprints shrank, wear time grew, algorithms improved. The sensor still sits in subcutaneous tissue and still requires biocompatible membrane chemistry to manage the body’s foreign-body response. Twenty-five years of refinement inside one architectural class. Biolinq broke the depth bracket. Apple is trying to eliminate the breach entirely. Optical is the only entry on this list with zero biological insult to skin. It is also the only one that hasn’t shipped.
Why optical is hard
Glucose has a fingerprint in the near-infrared. In the 1500 to 1700 nm band, glucose’s C-H bonds absorb in characteristic peaks at about 1536, 1595, and 1688 nm [Maruo 2003]. At a normal blood concentration of 5 mM, over a 1 mm path through the dermis, glucose contributes an absorbance of roughly 10⁻⁴ to 10⁻³. Small but visible: modern photodiodes can see it with modest averaging.
The hard part is that glucose sits inside a soup of other signals, all bigger, and the soup itself is moving. Pulling glucose out of that soup, repeatably and across people, is the actual work. The sources of that variation fall into four categories, and the architecture answers each one differently.
1. Other chemical absorbers. Water at 55 M dominates the spectrum, contributing absorbance three to four orders of magnitude larger than glucose. Lipid, hemoglobin, melanin, collagen, albumin, urea, and lactate add their own contributions on top. Each one is large in absolute terms but at a fixed magnitude per unit concentration. The architecture’s answer: choose the wavelength window where the glucose-to-water ratio is the most favorable, and use a narrow source linewidth so the glucose peak doesn’t get washed out by spectral averaging. (Layer 1.)
2. Biology that varies on minute-to-hour timescales. Skin hydration shifts with the day’s water intake. Perfusion shifts with meals, exercise, and emotion. Skin temperature shifts with ambient and circadian rhythm. These move the matrix contributions while you are taking a measurement. The architecture’s answer: measure each of these directly with auxiliary sensors and feed the readings to the inversion as covariates. (Layer 3.)
3. Biology that varies across people. Skin thickness, melanin density, capillary count, and dermal collagen structure are roughly constant for one person but vary substantially across a population. A model trained on one cohort will not generalize cleanly to another. The architecture’s answer: a brief personalized calibration window at first wear, similar to the warm-up of current invasive CGMs. (Outside the four-layer architecture; a deployment requirement.)
4. Mechanical state. Contact pressure compresses the tissue and shifts the optical path. Motion shifts which tissue volume is being sampled. These move on second-by-second timescales. The architecture’s answer: an inertial measurement unit (IMU) and a pressure transducer gate measurements out when the state is bad. Reduced duty cycle is the cost. (Layer 3.)
A 10% change in local hydration moves the water contribution by more than the entire glucose signal. The arithmetic is brutal, and ignoring any one category is what has defeated the field. The four layers below address all four together.
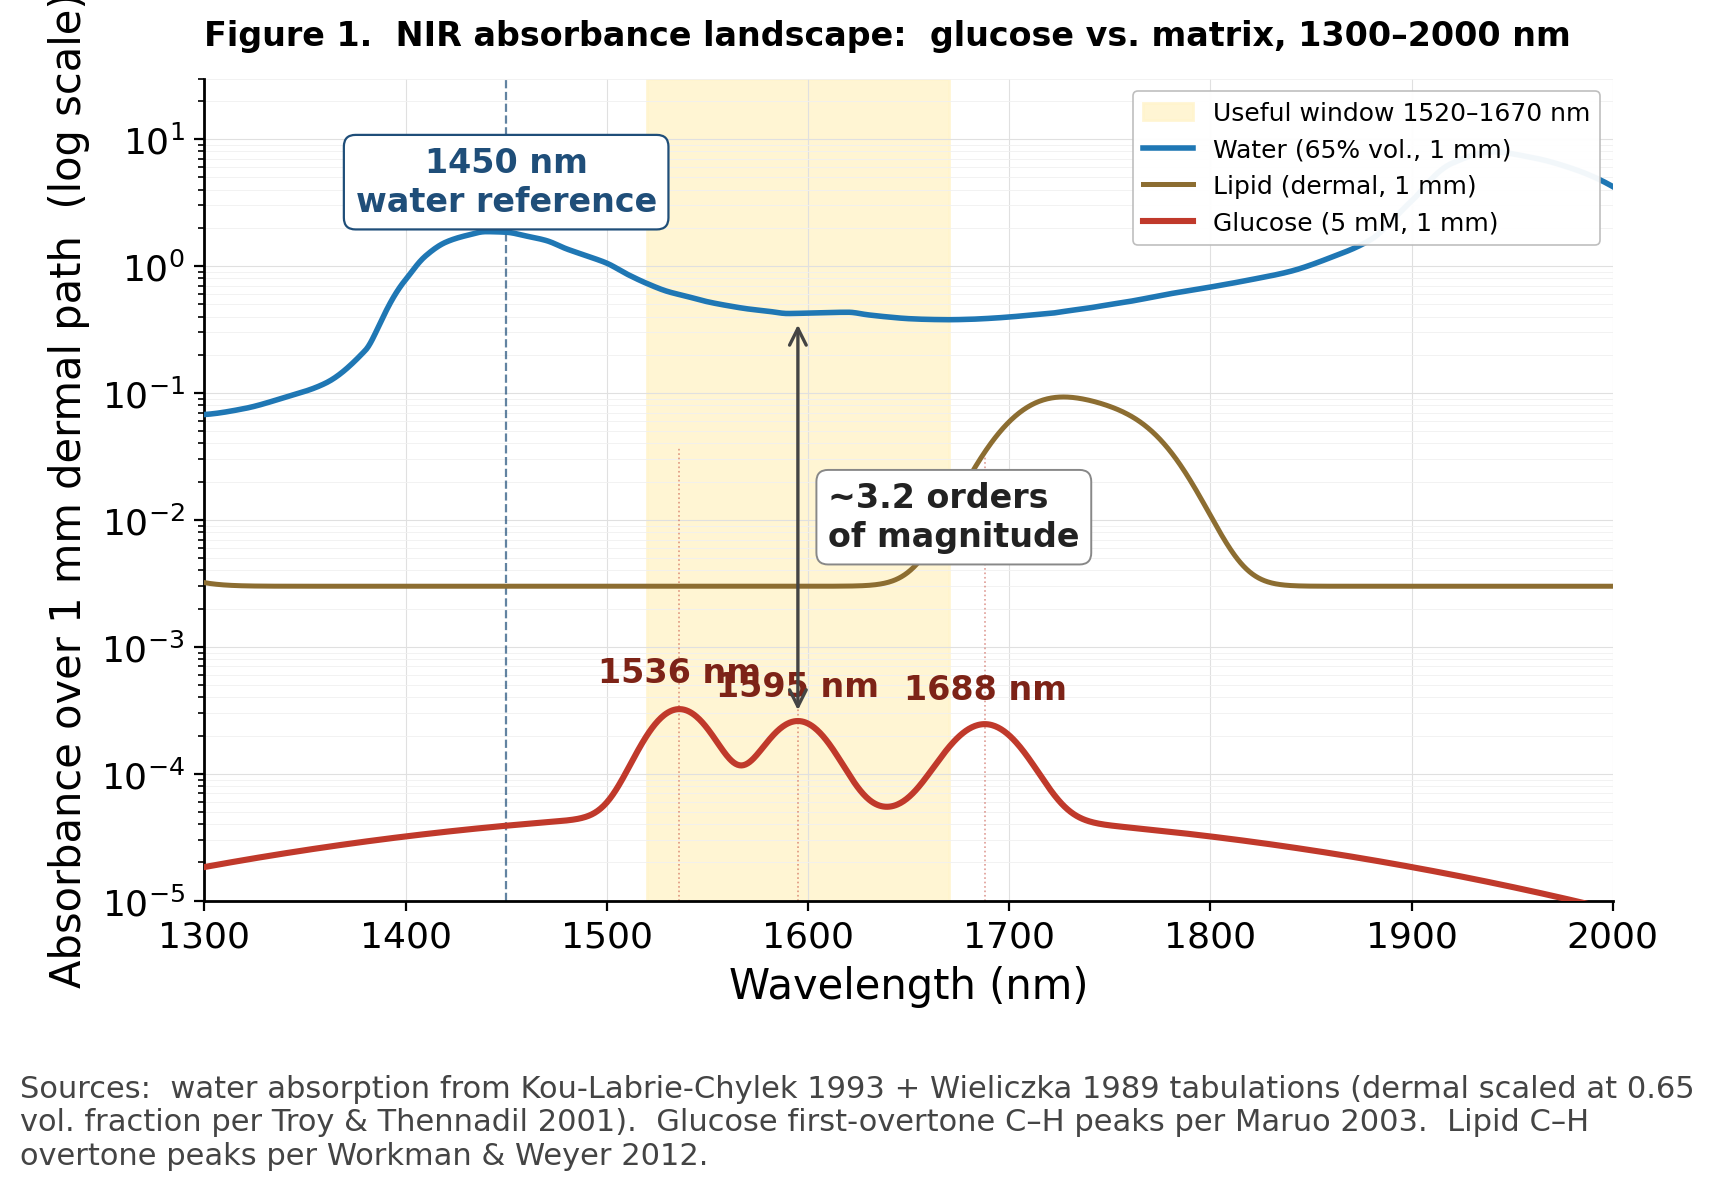
Figure 1. Glucose vs. matrix absorbance over a 1 mm dermal path, log scale. Water (blue) and lipid (olive) sit three to four orders of magnitude above the glucose first-overtone C-H peaks (red) at 1536, 1595, and 1688 nm. The yellow band marks the useful spectroscopic window where glucose signal and dermal photon penetration overlap. The arrow at 1595 nm marks the gap any architecture has to navigate.
The architecture, four layers
The architecture has four integrated layers. Each is a hypothesis with rationale and falsification criteria.
Layer 1: a four-element VCSEL array
Hypothesis. Four fixed-wavelength VCSELs (vertical-cavity surface-emitting lasers, the same source class behind the iPhone Face ID dot projector at 940 nm and the silicon-photonics datacom industry at 1310 and 1550 nm) at 1450, 1536, 1595, and 1688 nm, each with on-die thermal modulation of ±1 to ±5°C around its design wavelength.
Why these wavelengths. The 1500–1700 nm window is the only place in the NIR where glucose absorbs accessibly and photons can still reach the dermal capillary bed. Outside it, water absorption grows so steeply that the photon budget collapses. 1450 nm anchors against the bright water peak as a reference. 1536, 1595, and 1688 nm hit the three glucose first-overtone peaks.
Why VCSELs and not micro-LEDs. Micro-LEDs are the consumer display success story at sub-650 nm wavelengths. At 1500–1700 nm the platform looks different. Comparison on the metrics that matter here:
| Metric | VCSEL (indium phosphide [InP], 1500–1700 nm) | Micro-LED at 1500–1700 nm |
|---|---|---|
| Spectral linewidth (full width at half maximum) | 0.1–1 nm (cavity-defined) | 50–100+ nm in research devices (spontaneous-emission floor) |
| Reliability | Telecom-qualified. Roughly one device in a few hundred to a few thousand fails over five years of continuous operation | Not industrialized at this wavelength |
| Wall-plug efficiency at 1550 nm | 30–50% | <10% in research devices; efficiency falls sharply at narrow bandgaps |
| Manufacturing maturity at 1500–1700 nm | Telecom-volume datacom-transceiver platform with InP foundry ecosystem | No consumer-scale ecosystem |
VCSELs at 1500–1700 nm have cleared telecom-grade reliability already. Roughly one device in a few hundred to a few thousand fails over five years of continuous operation, demonstrated across two decades of datacom-transceiver deployment. Consumer-grade reliability is about ten times tighter (closer to one device in tens of thousands over five years), the bar Apple’s 940 nm Face ID VCSELs cleared across 100M+ units. That step from telecom to consumer at 1500–1700 nm is the engineering investment a glucose program would have to fund: a single platform-maturation step, not a platform created from scratch. Closing the linewidth, efficiency, reliability, and manufacturing gap for micro-LEDs at this wavelength is several investments, none of them yet underway at consumer scale.
Why fixed-wavelength elements rather than a tunable single source. Each VCSEL’s design wavelength is set in fabrication by the InP cavity geometry, not by holding the device at a particular operating temperature. All four elements run at roughly the same baseline (the package temperature, ~30°C). The on-die heater on each element provides ±1 to ±5°C of fine modulation around that baseline, shifting emission by ±0.06 to ±0.4 nm — enough for on-peak vs. off-peak ratio measurement, nothing more. Spanning the full 240 nm range with a single thermally-tuned device would require ~1300°C of swing, which no worn-device thermal budget can deliver, so the architecture commits to discrete wavelengths up front.
Thermal architecture and the cross-talk problem. Four heaters in a 0.5 × 0.5 mm chip will thermally interact. At 100 µm pitch the cross-talk coefficient α is roughly 10–30%: heating element A by 5°C raises element B’s substrate temperature by 0.5 to 1.5°C. That is 0.03 to 0.12 nm of unintended wavelength shift on B from A’s modulation, a substantial fraction of A’s intentional ±0.4 nm sweep. Two engineering responses, used in combination:
- Etched thermal trenches between adjacent elements, breaking the conduction path through the substrate. Lowers α to <5%. Costs fabrication complexity (deep silicon or III-V trenches, sometimes backside thinning).
- Measured cross-talk matrix M_ij captured at calibration. The controller pre-distorts heater currents during operation so that each element’s net temperature lands where intended. Costs a calibration step at manufacture and a small real-time computation.
The packaged four-element array is roughly 1 × 1 mm. Smaller than a grain of rice.
What would falsify this. A demonstrated NIR µLED at <50 nm linewidth and consumer manufacturing yield at 1500–1700 nm. A demonstrated MEMS-VCSEL with 10⁷+ thermal cycles of reliability across 5 years of worn-device life. A new wavelength that proved more separable from water than the four above.
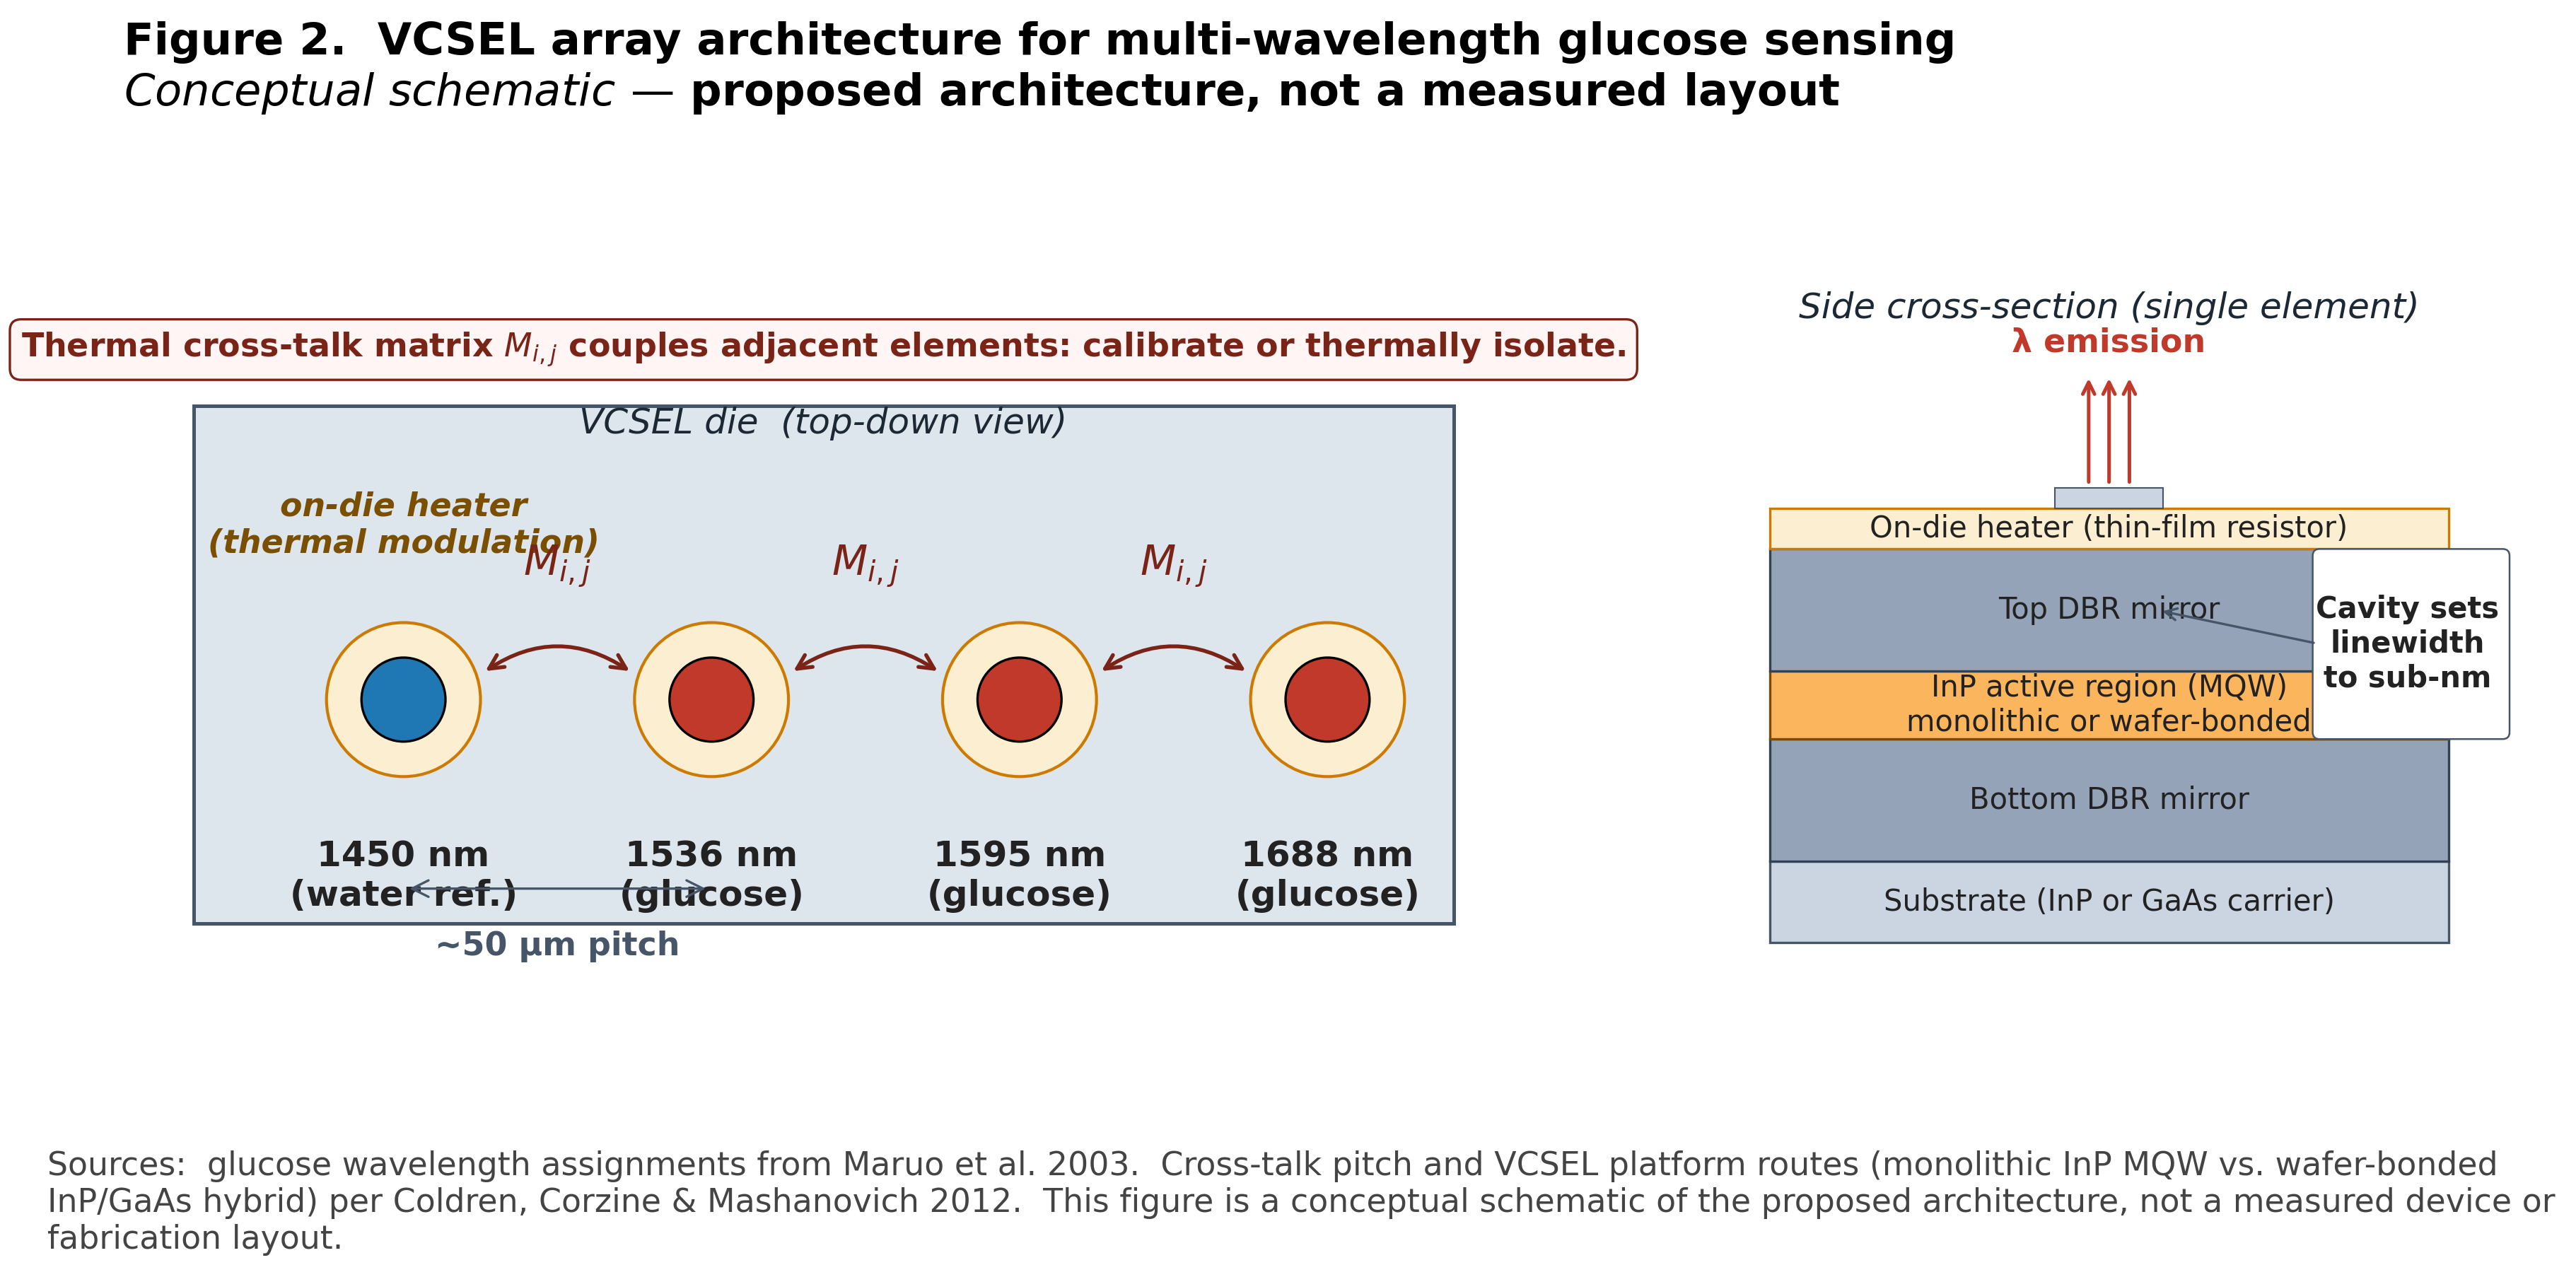
Figure 2. The four-element VCSEL array. Per-element die ~400 µm square, pitch 100–200 µm, optical aperture ~10 µm, overall footprint ~0.5 × 0.5 mm chip. On-die heater for ±1 to ±5°C control around each design wavelength. Cross-talk between adjacent heaters at 100 µm pitch is bounded at 10–30% of self-coupling and either reduced via etched trenches or calibrated out via a measured cross-talk matrix.
Layer 2: multi-distance geometry to land photons in the dermis
Hypothesis. A small array of photodiodes at different distances from the laser source on the underside of the watch: one near (~100 µm separation), one or more far (~500–800 µm). Two is the minimum for depth discrimination; three to six is more robust.
Why distance to the detector controls how deep you see. Skin scatters NIR light about ten times more strongly than it absorbs. A photon entering the skin at the laser gets bounced thousands of times before it either gets absorbed or wanders back out through the surface. The set of photons that emerges some distance ρ from where the laser put them in has, on average, traced an arc into the tissue and back: down, peak, up. The peak depth of that arc is roughly half the source-to-detector distance, ρ/2. That is a property of the random walk: to make it the lateral distance ρ before getting absorbed, photons statistically sample depths up to ~ρ/2 along the way.
A near detector at ρ₁ ≈ 100 µm catches photons whose arcs peaked at ~50 µm. They saw the top of the epidermis: stratum corneum, viable epidermis, no capillaries. A far detector at ρ₂ ≈ 600 µm catches photons whose arcs peaked at ~300 µm, well into the papillary dermis where the capillary bed sits and where the glucose-bearing blood lives.
Both detectors see the epidermis, because every photon enters and exits through it. The far detector sees the dermis on top of that. Subtract the near signal from the far signal with the right weighting, and the common epidermal contribution cancels. What is left is the dermal-specific spectrum. That is where the glucose information lives.
How many detectors. Two is the minimum for depth discrimination: one shallow, one deep. Three to six lets you reconstruct a fuller depth profile, handle people whose skin scatters differently, and improve robustness across wear cycles. Past six, photons reaching the farthest detector get rare enough that signal-to-noise drops faster than depth resolution improves, while chip area and electronic complexity keep growing. The right number is a programme decision: more for development and characterization, fewer for cost-optimized production.
What would falsify this. A coherence-gated or time-resolved approach that delivers sharper depth selectivity inside the watch’s power budget. Evidence that wrist-skin scattering varies too much across wear cycles for the multi-distance subtraction to converge. Evidence that a single-detector channel with sufficient algorithmic decoupling can replace the multi-distance subtraction.
Layer 3: auxiliary sensors for the things that move
Hypothesis. A small set of dedicated sensors capturing the matrix variables that move on physiological timescales: VCSEL die thermistor, skin contact thermistor, ambient temperature sensor, photoplethysmography (PPG) for perfusion, IMU for motion, pressure transducer for contact state.
Why this. The largest matrix variations are deterministic in their physics. Skin temperature shifts the water peak at 0.2–0.3 nm/°C and the glucose peak at 0.05–0.1 nm/°C; over a typical 7°C wrist temperature swing that is 1.75 nm and 0.5 nm of peak movement, both bigger than the precision the inversion needs. Hydration shifts water content. Perfusion shifts hemoglobin volume. Measure each one directly and feed it into the inversion as a covariate, instead of asking the model to learn the dependence from spectra alone. Motion and bad contact pressure trigger gating; bad data is dropped before it reaches the model. Reduced duty cycle is the cost.
What would falsify this. Evidence that the auxiliary measurements miss enough of the variation that the inversion cannot recover. Evidence that gating cuts duty cycle below clinical-utility thresholds.
Layer 4: physics-informed inversion for the residual
Hypothesis. A model trained on spectra plus the auxiliary-sensor measurements, with the known thermal-spectral dependencies and the Beer-Lambert forward physics encoded as deterministic corrections. The model learns only the residual.
Why this. Plain regression and partial least squares (PLS) chemometrics will latch onto whatever correlates with glucose in training, including hydration and temperature when those happen to correlate with glucose. That is the FDA-cited failure mode for non-invasive submissions [Arnold 2007]. Encoding the deterministic corrections in the forward model shrinks the hypothesis space from “any mapping from spectra to glucose” to “mappings consistent with the known temperature physics of water and glucose.” Spurious-proxy learning shrinks; it does not vanish.
What would falsify this. Evidence that the residual is too noisy or too non-stationary across people for the constrained model to land below the FDA’s integrated CGM (iCGM) accuracy bar. A demonstrated unconstrained deep model that holds accuracy across cohort, environment, and longitudinal shift.
Performance: matching the standard-of-care bar
Standard of care for continuous glucose monitoring is set today by Dexcom G7 and Abbott FreeStyle Libre 3. Both deliver mean absolute relative difference (MARD) of roughly 8–9% against laboratory reference glucose [Laffel 2023, Alva 2022]. The FDA’s iCGM Special Controls accuracy threshold sits near 10% MARD with specific accuracy distributions across glucose bins [FDA iCGM]. These numbers are the output of more than a decade of Phase 3 iteration on an invasive architecture; they are the bar a non-invasive device has to clear to compete on performance, not just on convenience.
The integrated four-layer architecture is dimensioned to two performance bands.
Controlled cohorts (subjects at rest, stable thermal state, gated wear, narrow demographic): target band 9–10% MARD, at or just above the iCGM threshold. Published non-invasive optical demonstrations have occasionally landed in this band under similar conditions. The architectural claim is that integrating all four layers makes those landings reproducible rather than occasional.
Representative real-world conditions (motion, ambient temperature swings, across skin types and wear cycles): anticipated band 12–18% MARD. The gap from the controlled-cohort target reflects residual sensor-skin interface noise that no architecture eliminates entirely. The gap is owned, not denied.
A first-generation device at 12–18% real-world MARD addresses different use cases than current invasive CGMs: metabolic-awareness monitoring for non-diabetic and prediabetic users, complement to invasive CGM for Type 1 trend awareness, trigger-to-test for Type 2 management. Insulin-dosing replacement for Type 1 requires <10% real-world MARD across the full deployment envelope, which is a five-to-ten-year Phase 3 iteration target rather than a first-product specification. The path to standard-of-care parity exists; it is not the first product release.
What would falsify this. Evidence that the integrated architecture cannot land below 12% MARD even in controlled cohorts. Evidence that residual sensor-skin interface noise is structurally floor-bound above the iCGM threshold across realistic populations. A regulatory or clinical pathway change that re-defines the iCGM accuracy bar.
Integration is the binding constraint
Hypothesis (the framing one). Non-invasive glucose has stayed unsolved for 25 years because no team has integrated all four layers into one coherent stack. Optics, scattering theory, silicon photonics, auxiliary state sensing, and physics-informed ML have each matured. Each layer’s experts have solved their part. The losses come at the seams.
What would falsify this. A non-invasive glucose monitor that ships and meets iCGM accuracy thresholds based primarily on a single-layer breakthrough: a fundamentally different sensing modality (Raman, photoacoustic, terahertz), a cleverer inversion, or an entirely different architecture, without the four-layer integration.
The toolkit is finally there. Narrow-linewidth lasers at the right wavelengths exist as compact semiconductor chips, smaller than a grain of rice. Silicon photonics, the technique of etching light-routing circuits into silicon chips on the same manufacturing base as computer processors, has matured. Integrated detectors, low-power on-watch computation, and physics-informed machine learning have all caught up. The remaining capability is the one that is hardest to copy and hardest to outsource: holding the four layers together long enough to ship.
The four-layer integration above is the most credible path to a shippable device on the engineering trade-offs as they stand today. The argument is offered for critique by practitioners and operators who see it differently.
About this article
A thought-leadership essay, not a peer-reviewed publication. Numerical claims trace to cited literature; every architectural claim is marked as hypothesis with rationale and falsification criteria. Comments and corrections welcome at ashutoshshastry.com or via LinkedIn. Views are the author’s own.
References
[Maruo 2003] K. Maruo et al., “In vivo noninvasive measurement of blood glucose by near-infrared diffuse-reflectance spectroscopy,” Appl. Spectrosc., vol. 57, no. 10, pp. 1236–1244, 2003.
[Arnold 2007] M. A. Arnold, J. T. Olesberg, and G. W. Small, “Selectivity assessment of noninvasive glucose measurements based on analysis of multivariate calibration vectors,” J. Diabetes Sci. Technol., vol. 1, no. 4, pp. 454–462, 2007.
[Workman 2012] J. Workman and L. Weyer, Practical Guide and Spectral Atlas for Interpretive Near-Infrared Spectroscopy, 2nd ed. CRC Press, 2012. (Source for water and glucose dλ/dT coefficients.)
[Coldren 2012] L. A. Coldren, S. W. Corzine, and M. L. Mashanovich, Diode Lasers and Photonic Integrated Circuits, 2nd ed. Wiley, 2012. (Source for VCSEL dλ/dT and InP-platform reliability framing.)
[FDA iCGM] U.S. Food and Drug Administration, “De Novo Classification Request for Dexcom G6 Continuous Glucose Monitoring System (iCGM), DEN170088,” 2018.
[Laffel 2023] L. M. B. Laffel et al., “Accuracy of a seventh-generation continuous glucose monitoring system in children and adolescents with type 1 diabetes,” Diabetes Technol. Ther., vol. 25, no. 2, pp. 125–132, 2023. (Dexcom G7 MARD reference.)
[Alva 2022] S. Alva et al., “Accuracy of the third generation of a 14-day continuous glucose monitoring system,” Adv. Ther., vol. 39, pp. 2839–2852, 2022. (Abbott FreeStyle Libre 3 MARD reference.)